
I keep singing the praises of clang, and with good reason – the clang project has been advancing the state of C/C++ compiler technology on Linux and OS X for quite a while now.
The modular design of the compiler has also enabled the creation of a set of ancillary tools, including run-time “sanitizers” (which I wrote about earlier), as well as pretty-printers, and a tool to automatically upgrade code to C++11.
Today I want to talk about clang’s static analysis engine, which can do a deep-dive on your code and find problems that are hard for a human to detect, but that are amenable to a brute-force approach that models the run-time behavior of a piece of code, but at compile-time.
This is very different from dynamic analysis tools, like valgrind and clang’s own sanitizers, which instrument the code at run-time to detect actual errors (e.g., reading uninitialized memory) that happen while the code is running. With dynamic analysis, the only errors that can be detected are in code that is actually executed, so a latent bug that only manifests under unusual conditions1, can go un-detected. By contrast, static analysis can potentially find bugs in code that is never (or almost never) actually executed.
Sounds good, no? Who wouldn’t want to find bugs “automagically”, without even needing to do any testing. (Cause we all know how much programmers love testing ;-)
For example, running clang’s static analyzer on some sample code turns up warnings similar to the following:
- Value stored to ‘x’ is never read
- The right operand of ‘!=’ is a garbage value
- Potential leak of memory pointed to by ‘x’
- Function call argument is an uninitialized value
- Use of memory after it is freed
- Called C++ object pointer is null
Some of the above warnings (e.g., value stored is never read) are most likely harmless, and just sloppy coding (perhaps because of copy-paste syndrome, about which I have more to say here). Others (e.g., called pointer is null), might be false positives, given the algorithms the analyzer uses2. Or, they could be real bugs that you just haven’t hit yet, because the code is (almost) never executed.
Those are the really scary bugs, along with the ones where you can “get lucky” most of the time … except when you don’t. The “garbage value” and “unitialized value” warnings fall into that category, and can be very hard to eyeball. Again, dynamic analysis tools like valgrind can help find these bugs, but only if you hit that code in testing.
So, static analysis is good, but it’s not magic. Static analyzers can only find bugs that they are programmed to find, and they certainly don’t find all bugs. For instance, here’s a bug that clang’s static analysis doesn’t find:
1 2 3 4 5 6 7 | |
But the fact is that static analysis will find bugs, and it will find bugs that you most likely wouldn’t find on your own, so it’s a a good tool to have in your toolbox. So, let’s take a look at how to do that using clang.
The first step is to install clang. If you’re on OS X or Ubuntu, you should already have it, but if you’re on RedHat this can be a bit tricky, so see my previous post on how to get clang working. (I’ve updated that post to add instructions for installing some of the static analysis tools that don’t normally get installed with clang).
It turns out that there are three (3) different ways to run clang’s static analyzer on your code, each with its own benefits and drawbacks. We’ll consider each of these in turn:
Integrated with a typical build
If you use reasonably normal-looking makefiles to build your code, you can get static analysis going with a minimum of fuss. If you’re using cmake to create your makefiles, the same approach will work fine, so long as you’re not overriding the values of CMAKE_C_COMPILER etc. (And, as usual, if you’re using autotools, you’re on your own;-).
In this approach, you export some environment variables to invoke the analyzer instead of the compiler, like the following:
| Variable | Value | Meaning |
|---|---|---|
| CC | ccc-analyzer | C compiler is redirected to clang analyzer (which in turn invokes the compiler, using the value of CCC_CC, below). |
| CXX | c++-analyzer | Similar to above, but for C++. |
| CCC_CC | clang | This environment variable is used by ccc-analyzer to invoke the actual C compiler. |
| CCC_CXX | clang++ | ditto |
| LD | clang++ | Specifies that the actual compiler should be used for linking. |
| CCC_ANALYZER_VERBOSE | 1 | (Optional) Set this flag to get verbose output from the analyzer, including the list of errors checked. |
With those variables set, you should just be able to invoke make to build your project, and Bob’s your uncle.
One nice thing about this approach is that you get both compiler warnings and analyzer warnings together – first, the analyzer invokes the compiler on the source file, and then performs the static analysis.
Using the GUI tool
In a similar fashion as ccc-analyzer (above) front-ends make, you can use clang’s scan-build tool to front-end ccc-analyzer. In addition to invoking the compiler and analyzer, scan-build also collects the analyzer reports, including the control flow that the analyzer used to infer any errors, and presents that using a set of html pages that are written by default to the /tmp directory, and that look like this:
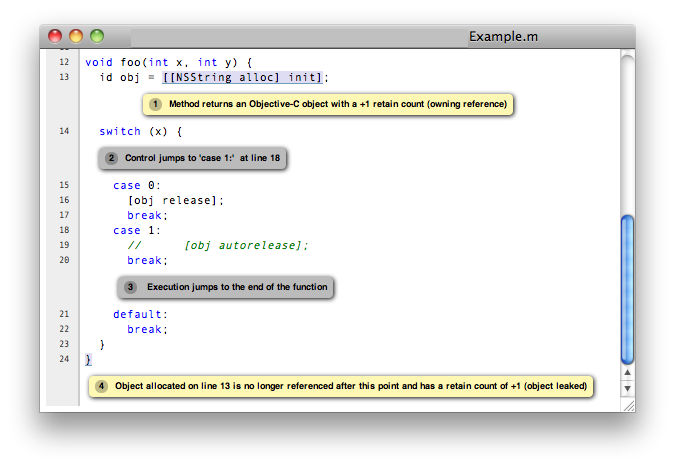
Personally, I find this fascinating. Not only does the analyzer tell about what it thinks is a problem, but also why it thinks so.
In the example above, you can see the steps that the analyzer follows to figure out that there is a problem with the code. If you are wondering whether a particular warning is a false positive or not, this presentation can help you figure that out. 3 It can also sometimes provide unexpected insights into the code that you might not come up with on your own.
To use this approach, you set your environment variables the same as described above, but instead of running make, you run scan-build -V make. This will run your build and then launch a browser to view the results of the build.
A small hitch…
Unfortunately, scan-build (and its scan-view companion) are not installed by default with clang. I’ve updated the build script from my earlier post on building clang on RedHat to install these files, but if you want to do it manually, run the following from the source tree you used to build and install clang:
1 2 3 4 5 6 7 | |
Another small hitch…
In an earlier post, I talked about how to use the -isystem flag to prevent selected headers from generating warnings. Unfortunately, the clang analyzer chokes on that flag – so if you’re using it, you will need to apply the patch below to successfully run the analyzer.
1 2 3 4 5 6 7 8 9 10 11 12 13 14 15 | |
Using a compilation database
Last but not least, you can also use a “compilation database” to invoke the static analyzer directly. So, what is a compilation database, you ask? This is a simple format introduced by clang that records the actual commands used to generate intermediate build products from source files, along with their parameters.
The analyzer needs this information to reproduce the environment used by the compiler, including pre-processor definitions and include file search paths.
If you are using cmake to drive your builds, creating a compilation database couldn’t be easier – simply add the -DCMAKE_EXPORT_COMPILE_COMMANDS=ON parameter to the cmake build command, or add the following to your main CMakeLists.txt file:
set(CMAKE_EXPORT_COMPILE_COMMANDS ON)
If you’re not using cmake, you can still create a compilation database using plain old make by front-ending make with Bear4, like so:
bear make
This will use Bear to drive the make process, leaving a compile_commands.json file in the current directory.
Once you’ve got the compilation database, invoking the analyzer can be done with a command like the following:
1 2 3 4 5 6 7 8 9 | |
(There are simpler ways to invoke the analyzer, but the approach shown here will visit each source file in the same order that it was originally built, which can be handy).
Conclusion
As we said earlier, static analysis is not magic, and it certainly won’t find all your bugs. But it will probably find some, and the ones it finds are likely to be nasty, so it’s worth a certain amount of trouble.
Last but not least, this is by no means a complete explanation of clang’s analyzer. Like much of clang, the documentation lags the code, sometimes by a lot, so much of this information was obtained by trial-and-error, and/or by reading the code. So, if you find something interesting, please drop me a line, or leave a note in the comments section.
References
http://clang-analyzer.llvm.org/index.html
http://clang.llvm.org/docs/ClangCheck.html
-
These are often called “Heisenbugs”, in a nerd-humor pun on the Heisenberg Uncertainty Principle.↩
-
For instance, clang’s analayzer attempts to figure out if a pointer can possibly be NULL by seeing if there is any code that checks for that condition. If there is, then clang complains about any code that dereferences the pointer outside an
if (x != NULL)block. This algorithm isn’t perfect, but it’s about the best that can be done, especially since the analyzer only looks at a single file at a time.↩ -
At least in my experience, many of the warnings that appear at first to be false positives turn out to be real bugs, especially if you follow through the control flow the analyzer uses.↩
-
Building and installing Bear from source is relatively straightforward – just keep in mind that you need python >= 2.7.↩