
- Testing Static Analysis Tools
- Can I haz teh codez?
- Creating a compilation database
- Establishing a baseline
- Using clang’s analysis tools
- Running clang analysis (again)
- Using cppcheck
- Comparing clang and cppcheck
- Conclusions
- Acknowledgements
- References
In my day job, one of my main focuses is software reliability and correctness, so it makes sense that I would be a big fan of static analysis.
I’ve written previously about the static analysis provided by clang. Today, I want to take a bit of a “deep-dive” into the whole subject by putting both clang and cppcheck through their paces, using them to analyze a benchmark suite designed to exercise static analysis tools. In the course of doing that, I’ll also provide some helper scripts that make working with the tools easier.
Testing Static Analysis Tools
And what is good Phaedrus, and what is not good – need we ask anyone to tell us these things? 1
Obviously, the ultimate goal is to be able to run static analysis tools against our own codebase(s) to help detect and fix problems. But how do we know if a particular tool is actually finding problems? And, how do we know if we’re running the tool properly?
The perfect static analyzer would find all the latent bugs in our code, while not reporting any false positives2. Since there are no perfect analyzers, any tool we use is going to miss some errors, and/or wrongly flag correct code. So, the only way to evaluate an analyzer is to know where all the bugs are in our code – but if we knew that, we wouldn’t need an analyzer.
That’s a dilemma. To resolve it, we’re going to be using a codebase specifically designed to trigger static analysis warnings. The code was originally developed by Toyota ITC, and is available on John Regehr’s excellent blog.
The ITC benchmarks attempt to resolve our dilemma by providing both a set of code that contains errors which should trigger warnings, as well as a second set of code, similar to the first, but which doesn’t contain errors. Each source file is annotated with comments documenting where the errors are (and aren’t). And that lets us create a catalog of both real errors and potential false positives3.
To get started, download the code from its GitHub repository, and set the ITCBENCH_ROOT environment variable (which will come in handy later):
$ git clone https://github.com/regehr/itc-benchmarks
$ export ITCBENCH_ROOT=$(pwd)/itc-benchmarks
Can I haz teh codez?
The remainder of this article goes step-by-step through the process of creating a compilation database from the ITC benchmark code, running clang’s static analysis tools against that compilation database, building and installing cppcheck and running it against the compilation database, and analyzing the results.
This is all good stuff, especially if you’re going to be using these tools going forward. But, there’s a certain amount of unavoidable yak-shaving4 going on to get to that point. So if you prefer to skip all that, I’ve included the results of running the different tools in the samples directory of the repo. The samples include all the files we’re going to be generating the hard way, so you can follow along without all the requisite busy-work. Hopefully, when we’re done you’ll want to go back and use these tools on your own codebase.
Creating a compilation database
To run both clang and cppcheck we first need to create a “compilation database” to supply them with required build settings. The compilation database format was developed as part of the clang project, to provide a way for different tools to query the actual options used to build each file.
A good overview of how the compilation database works with clang-based tools can be found at Eli Bendersky’s excellent site. His article illustrates the importance of making sure that code analysis tools are looking at the same (pre-processed) source that the actual compiler sees, in order to generate meaningful diagnostics with a minimum of false positives.
-
If you are using cmake to drive your builds, creating a compilation database couldn’t be easier – simply add the
-DCMAKE_EXPORT_COMPILE_COMMANDS=ONparameter to the cmake build command, or add the following to your main CMakeLists.txt file:set(CMAKE_EXPORT_COMPILE_COMMANDS ON) -
If you’re not using cmake, you can still create a compilation database using plain old make by front-ending make with Bear5, like so:
bear make
In either case, the end result should be the creation of a compile_commands.json file in the current directory.
Sadly, the ITC benchmark suite is stuck in the past using autotools, and worse yet, a version that needs to be installed from source (on RH6, at least).
So, in the interest of immediate gratification, I’ve included the compile_commands.json file here – simply save it to the directory where you’ve cloned the ITC code. (The compile_commands.json file is also contained in the samples directory of the repo for this article).
If you prefer to generate the compile_commands.json file yourself using Bear, you can do so like this:
$ cd ${ITCBENCH_ROOT}
$ ./bootstrap
$ ./configure
$ bear make
Establishing a baseline
To make it possible to compare results from different analyzers, we first need to establish a baseline using the ITC benchmarks, and for that we’re going to need this set of helper scripts, which can be downloaded from this GitHub repo.
$ git clone https://github.com/btorpey/static
Once you’ve done that, you need to add the directory to your PATH:
$ export PATH=$(pwd)/static/scripts:$PATH
Enter the following command from the ITC source directory to create a csv file with the error annotations from the ITC code:
$ cd ${ITCBENCH_ROOT}
$ cc_driver.pl -n grep -Hni ERROR: |
itc2csv.pl -r ${ITCBENCH_ROOT}/ |
sort -u > itc.csv
The command will create a file named itc.csv in the source directory that looks like this:
$ cat itc.csv
"01.w_Defects/bit_shift.c:106","/*ERROR:Bit shift error*/"
"01.w_Defects/bit_shift.c:120","/*ERROR:Bit shift error*/"
"01.w_Defects/bit_shift.c:133","/*ERROR:Bit shift error*/"
"01.w_Defects/bit_shift.c:146","/*ERROR:Bit shift error*/"
"01.w_Defects/bit_shift.c:163","/*ERROR:Bit shift error*/"
"01.w_Defects/bit_shift.c:175","/*ERROR:Bit shift error*/"
...
The format of the csv file is really simple – just an entry for file and line number, and another with the error annotation munged from the source file. This will give us a baseline against which to compare both clang and cppcheck.
Using clang’s analysis tools
In a couple of previous posts, I wrote about static analysis with clang, and how to build clang. This next bit assumes that you’ve got clang ready-to-go, but if that’s not the case, there can be a fair amount of work required to get to that point, so you may want to skip ahead to the section on using cppcheck.
We’re going to use a similar approach to the one we used above to generate the list of expected errors from the ITC code. The command below will run clang-check against all the files in compile_commands.json, filter the results, and reformat the output in csv format:
$ cd ${ITCBENCH_ROOT}
$ cc_driver.pl clang-check -analyze 2>&1 |
clang2csv.pl -r ${ITCBENCH_ROOT}/ |
sort -u > clangcheck.csv
This gives us the diagnostic messages produced by clang, in the same csv format as we used for the list of errors, above:
$ cat clangcheck.csv
"01.w_Defects/bit_shift.c:106","warning: The result of the '<<' expression is undefined"
"01.w_Defects/bit_shift.c:133","warning: The result of the '<<' expression is undefined"
"01.w_Defects/bit_shift.c:146","warning: The result of the '<<' expression is undefined"
"01.w_Defects/bit_shift.c:163","warning: The result of the '<<' expression is undefined"
"01.w_Defects/bit_shift.c:175","warning: The result of the '<<' expression is undefined"
...
We can already see that there are some differences: the ITC code expects to see a diagnostic at 01.w_Defects/bit_shift.c:120, but clang doesn’t output a warning for that line.
Analyzing the results
What I like to do at this point is fire up my all-time favorite tool, Beyond Compare, to generate a visual diff of the two files:
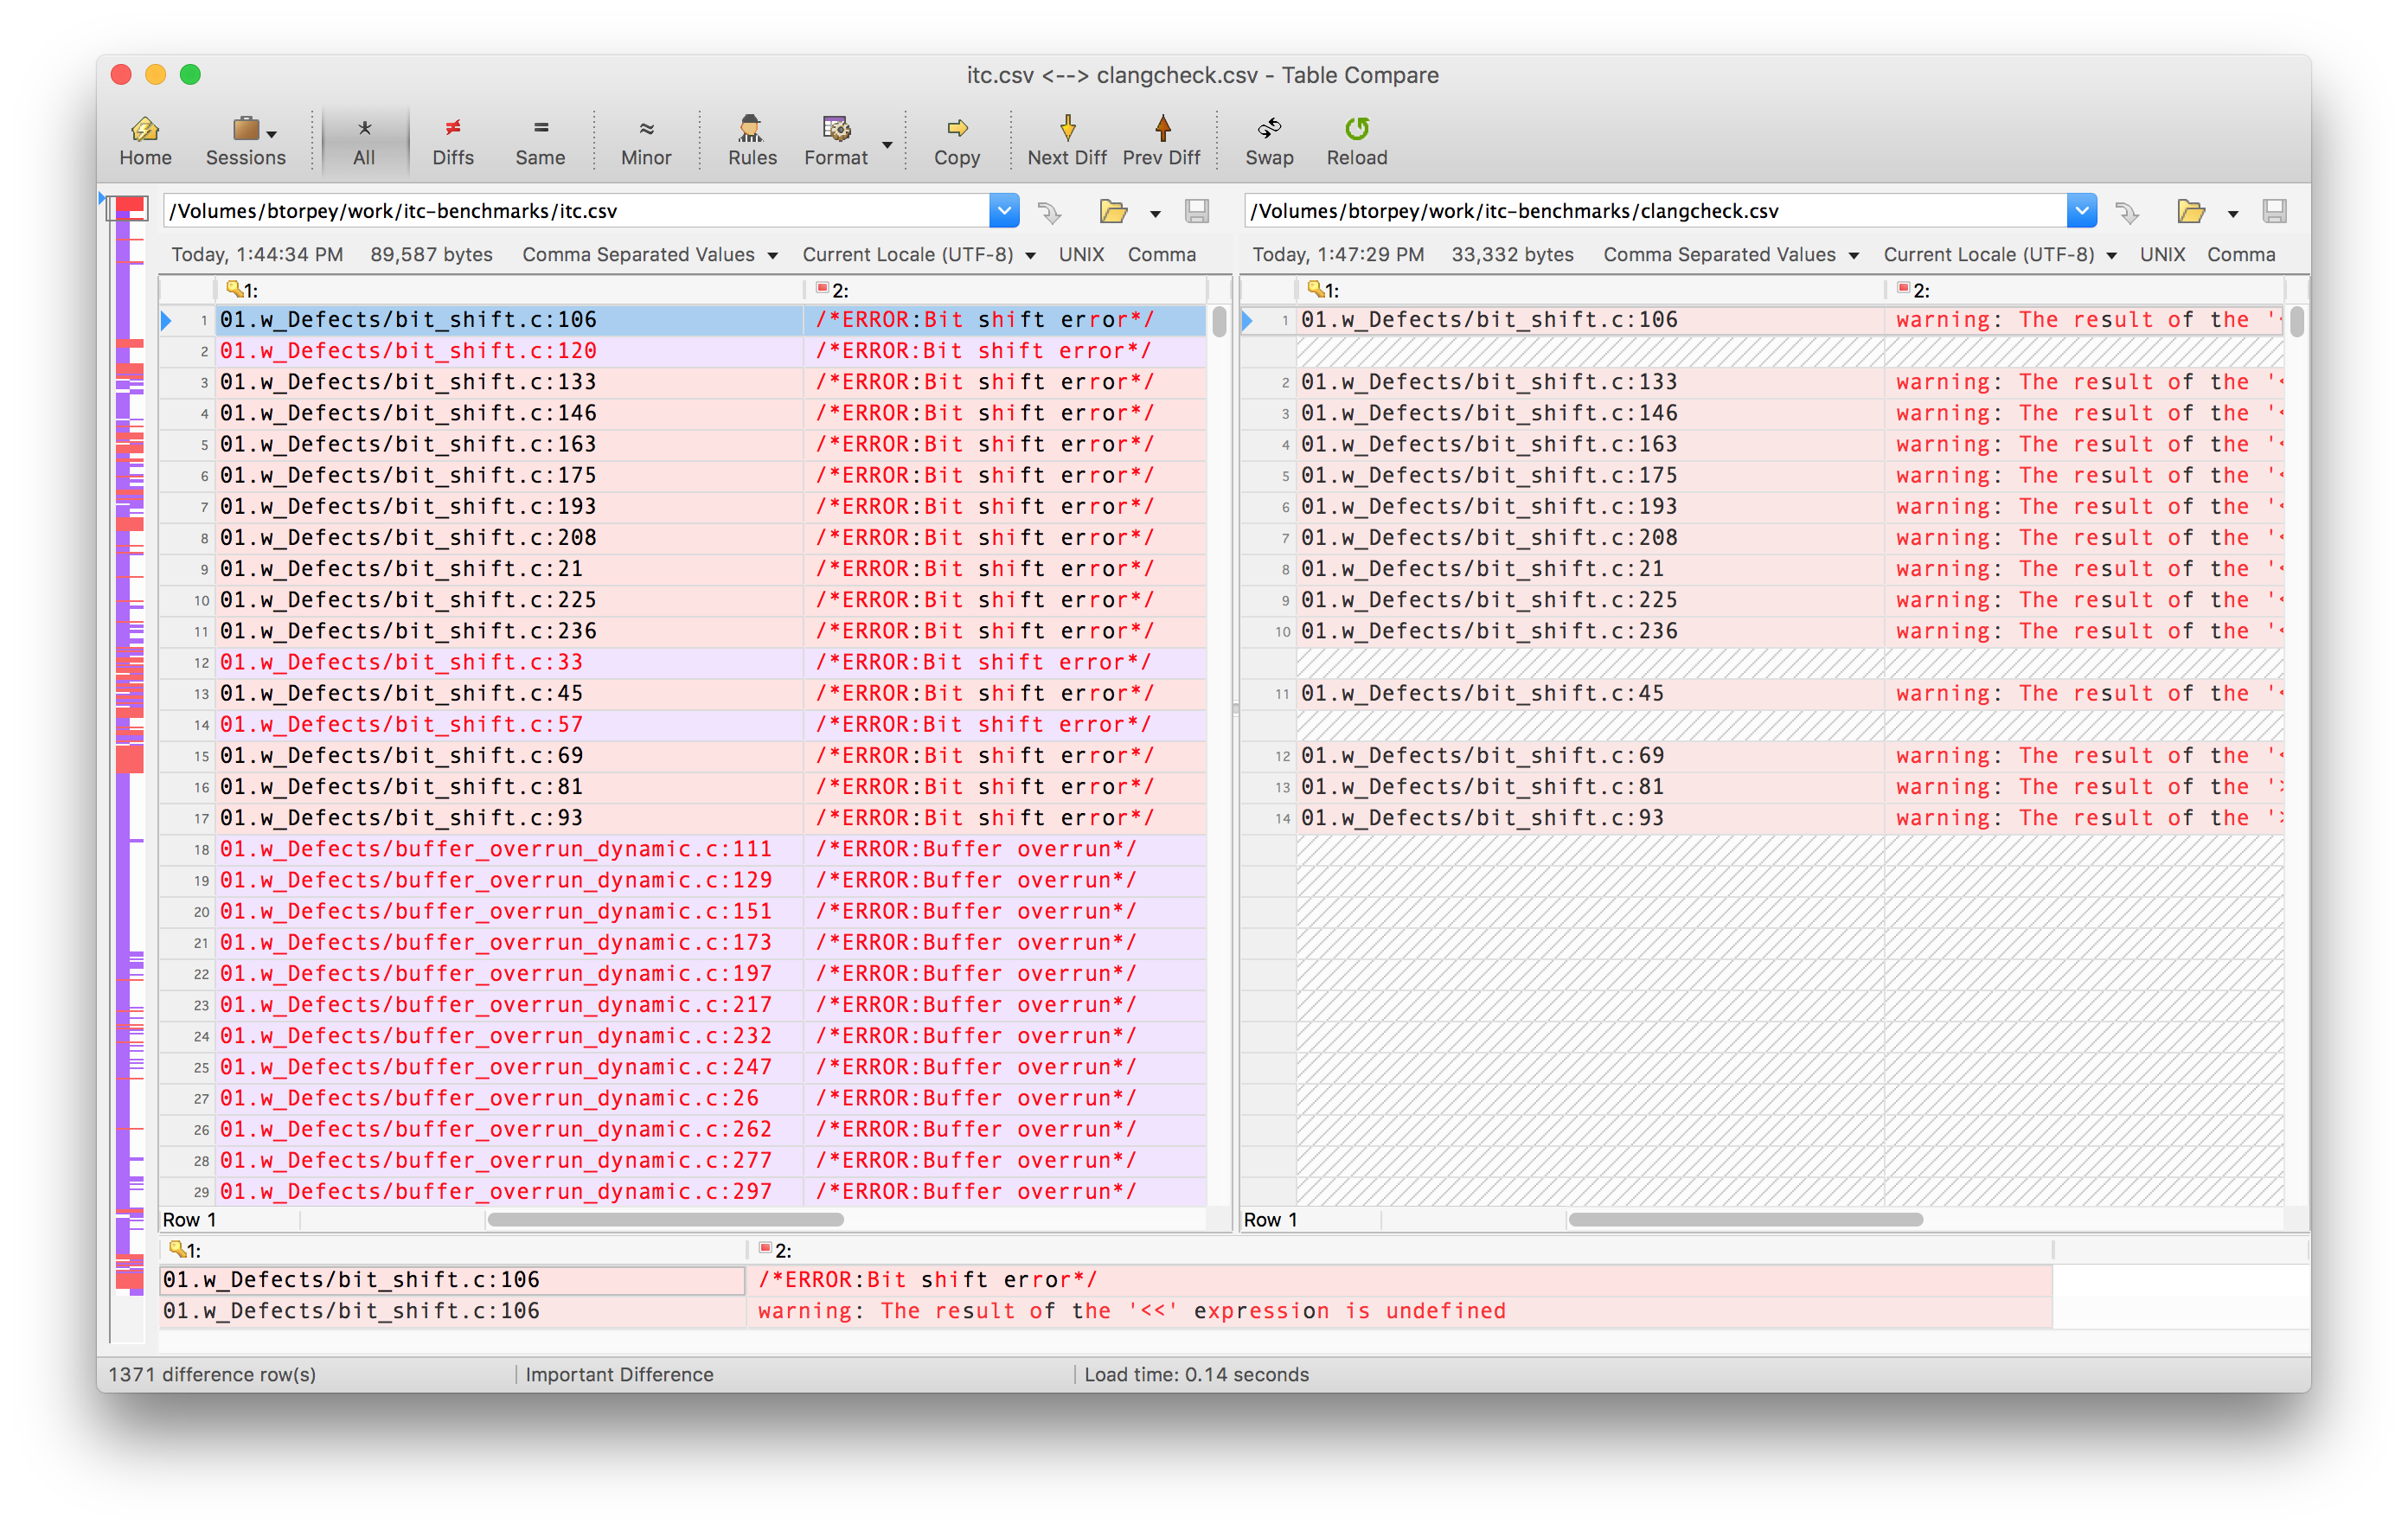
This view shows the expected diagnostics extracted from the ITC source files on the left, alongside the diagnostics generated by clang on the right. We can see that clang catches some of the bugs in the source file, but misses others. If we continue to read down the two files, we’ll also see some potential “false positives” – i.e., diagnostics issued by clang that are not marked as expected errors in the source files.
The visual approach using Beyond Compare works well for me, but with a csv-formatted datafile, other approaches are possible as well. We could import the diagnostic messages into a spreadsheet program, or even a DBMS, for archiving, tracking and comparison.
Running clang analysis (again)
clang actually has two tools for doing static analysis – in the example above we ran clang-check -analyze, but now we’re going to use clang-tidy instead.
$ cd ${ITCBENCH_ROOT}
$ cc_driver.pl clang-tidy 2>&1 |
clang2csv.pl -r ${ITCBENCH_ROOT}/ |
sort -u > clangtidy.csv
If you compare the results from clang-check and clang-tidy, you’ll notice that clang-tidy generally reports more warnings than clang-check. Some of them are not necessarily defects, but are arguably bad practice (e.g., using strcpy).
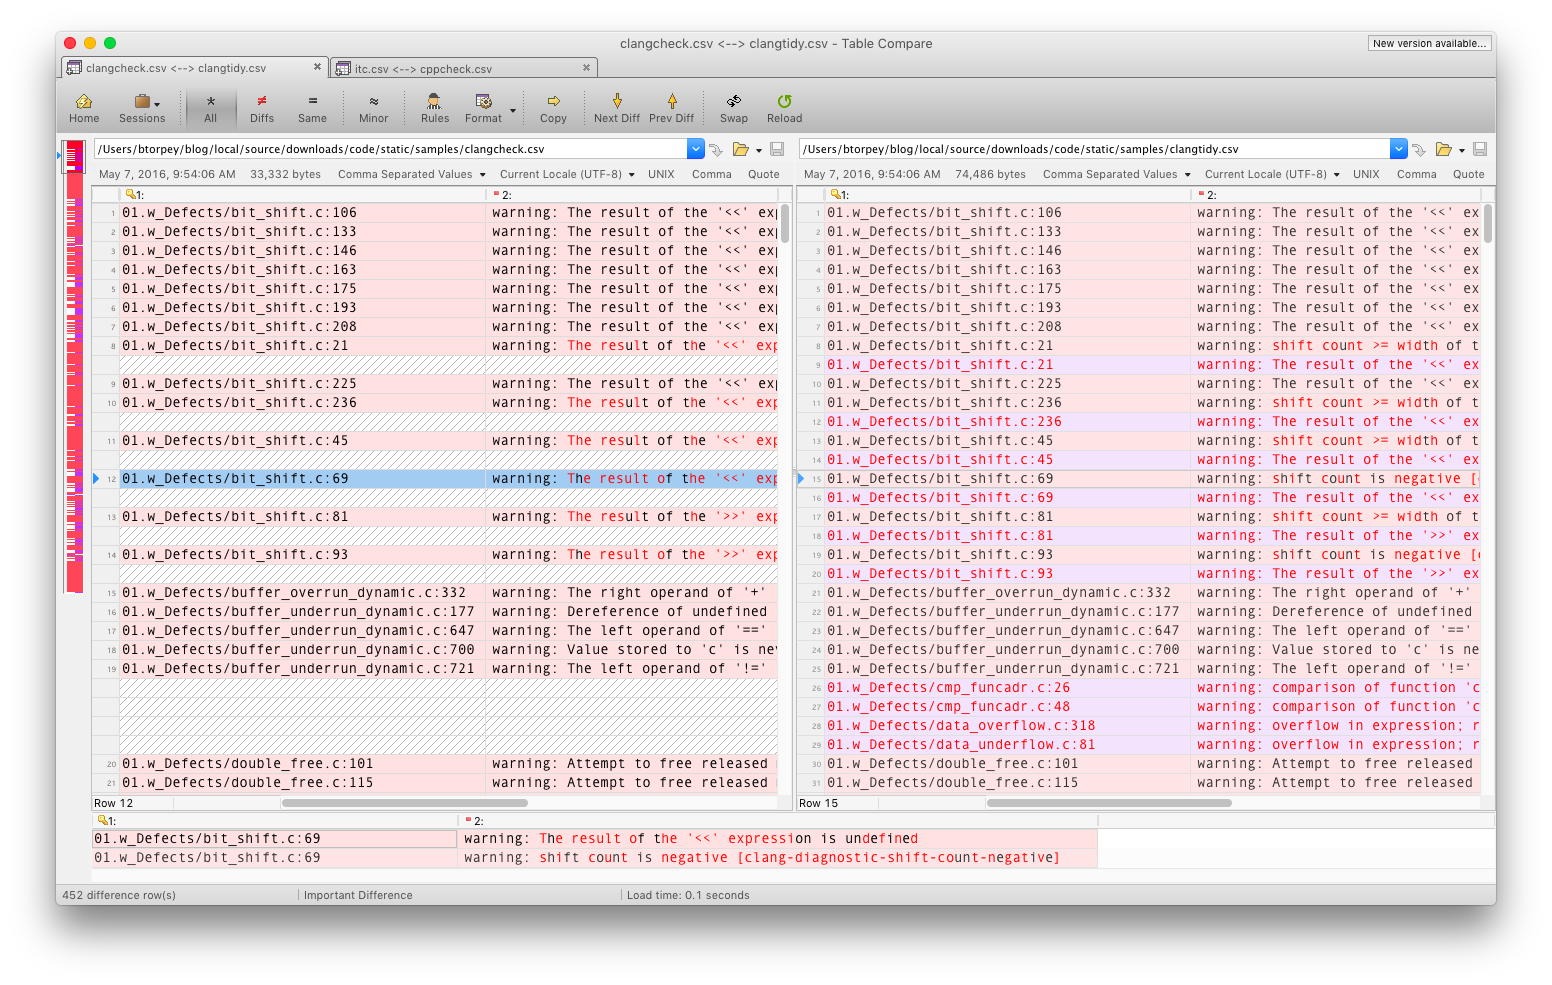
clang-tidy also outputs a slightly different format, including the name of the check in brackets. (The name can also be used to suppress the warning).
The choice of which to use is up to you – my preference is to use clang-check first, and follow up with clang-tidy, simply because the warnings produced by clang-tidy either duplicate those from clang-check, or are not as serious.
Note that you can get a list of available checks from clang with the following command:
$ clang -cc1 -analyzer-checker-help
...
core.DivideZero                 Check for division by zero
core.DynamicTypePropagation     Generate dynamic type information
core.NonNullParamChecker        Check for null pointers passed as arguments to a function whose arguments are references or marked with the 'nonnull' attribute
core.NullDereference            Check for dereferences of null pointers
core.StackAddressEscape         Check that addresses to stack memory do not escape the function
Using cppcheck
There’s another static analysis tool that can provide results comparable to clang. cppcheck has been around for a while, and I had tried to get it working in the past, but had given up after bumping into a few problems.
I kept hearing good things about cppcheck in articles and presentations by others, though, so I finally decided it would be worth the trouble to get it working.
It turns out the problems were not that difficult to solve, given a combination of documentation and experimentation. And the benefits were significant, so I’m quite happy to have added cppcheck to my tool box.
Installing cppchceck
While cppcheck is available bundled with some distros, it’s often an older version, so we’re going to build and install it from source. As is more and more often the case, cppcheck has started using features of C++1x, so we’re going to need a C++1x-capable compiler to build it.
If you’re on an older distro (in my case, RH6) where the system compiler is not C++1x-capable, see my earlier post about how to build clang (and/or gcc) to get a C++1x-capable compiler. (Basically, it uses an older version of gcc to build a newer version, and the newer version to build clang).
It took some trial-and-error to get the cppcheck build parameters right, but the supplied build script should get the job done6.
$ ./build_cppcheck.sh 2>&1 | tee build_cppcheck.out
Verifying the installation
You’ll need to add the cppcheck directory to your PATH (assuming the install location from the build script):
$ export PATH=/build/share/cppcheck/1.73/bin:$PATH
If the build and install process worked, you should be able to invoke cppcheck from the command line, like so:
$ cppcheck --version
Cppcheck 1.73
If you see the message below instead, there’s a problem with the RPATH setting:
$ cppcheck --version
cppcheck: /usr/lib64/libstdc++.so.6: version `GLIBCXX_3.4.15' not found (required by cppcheck)
The problem is typically either that the RPATH setting in the build is incorrect, or that the directory referenced by the RPATH setting does not exist.
Running cppcheck
Now we’re ready to run cppcheck, using the same approach we used with clang:
$ cd ${ITCBENCH_ROOT}
$ cc_driver.pl cppcheck.sh  2>&1 |
cppcheck2csv.pl -r ${ITCBENCH_ROOT} |
sort -u > cppcheck.csv
Note that instead of invoking cppcheck directly, we’re invoking it via the cppcheck.sh helper script, which supplies needed parameters to cppcheck. It also creates an include file with the compiler’s pre-defined macros, so those definitions will be visible to cppcheck. This turns out to be particularly important with cppcheck, especially if the code you’re trying to analyze uses #ifdef’s to control what code actually gets compiled (or seen by cppcheck)7.
One of the settings in the helper script enables what cppcheck calls “inconclusive” results. These are exactly what the name implies – cppcheck isn’t positive that the code is wrong, but it is at least suspicious. Including these inconclusive results should tend to increase the number of false positives in theory, but in practice I haven’t found false positives to be a big problem with either cppcheck or clang.
Analyzing the results
One of the first things you notice with cppcheck is that it includes more checks than clang. Some of the additional warnings are for constructs that are not exactly wrong, but are either non-optimal, or indicators of potential problems. For instance, cppcheck will warn when a variable is defined in a broader scope than is actually required (“scope … can be reduced”).
You can get a list of all the checks cppcheck is performing like so:
$ cppcheck --doc
...
## Other ##
Other checks
- division with zero
- scoped object destroyed immediately after construction
- assignment in an assert statement
- free() or delete of an invalid memory location
- bitwise operation with negative right operand
- provide wrong dimensioned array to pipe() system command (--std=posix)
You can also generate a list of error ID’s with this command:
$ cppcheck --errorlist
<error id="stringLiteralWrite" severity="error" msg="Modifying string literal directly or indirectly is undefined behaviour."/>
<error id="sprintfOverlappingData" severity="error" msg="Undefined behavior: Variable 'varname' is used as parameter and destination in s[n]printf()."/>
<error id="strPlusChar" severity="error" msg="Unusual pointer arithmetic. A value of type 'char' is added to a string literal."/>
<error id="incorrectStringCompare" severity="style" msg="String literal "Hello World" doesn't match length argument for substr()."/>
<error id="literalWithCharPtrCompare" severity="style" msg="String literal compared with variable 'foo'. Did you intend to use strcmp() instead?"/>
<error id="charLiteralWithCharPtrCompare" severity="style" msg="Char literal compared with pointer 'foo'. Did you intend to dereference it?"/>
<error id="incorrectStringBooleanError" severity="style" msg="Conversion of string literal "Hello World" to bool always evaluates to true."/>
You can suppress any errors you don’t care to see by passing its id in the --suppress= flag.
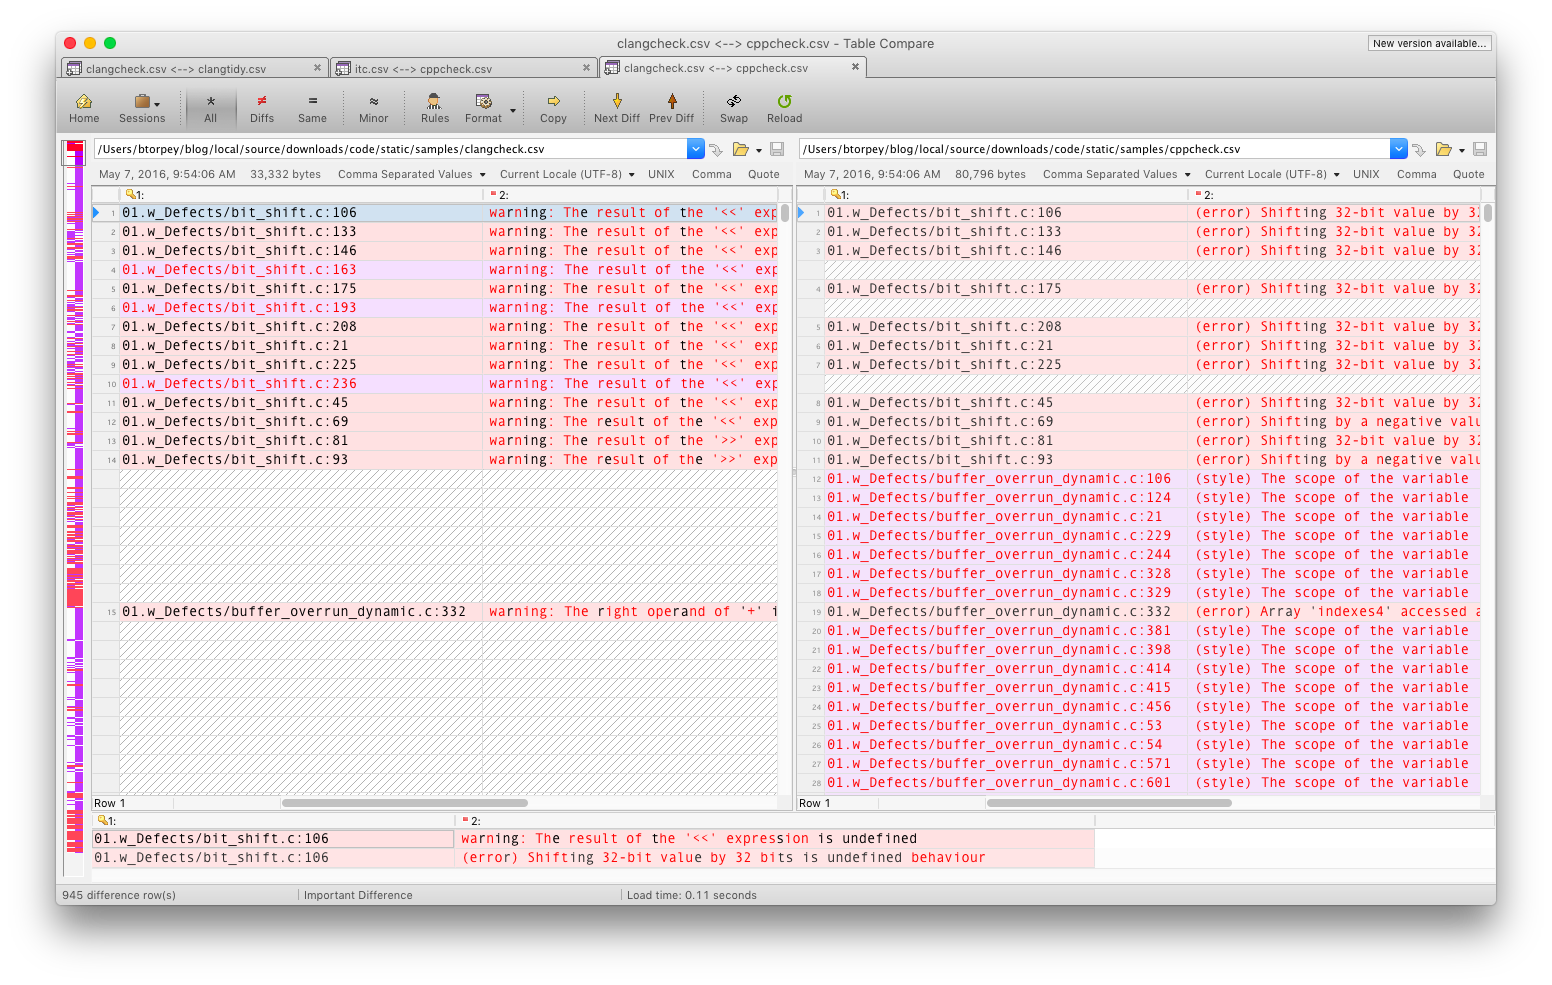
Comparing clang and cppcheck
There’s a school of thought that says you should use as many compilers as possible to build your code, because each one will find different problems. That’s still a good idea, and even more so with static analysis tools.
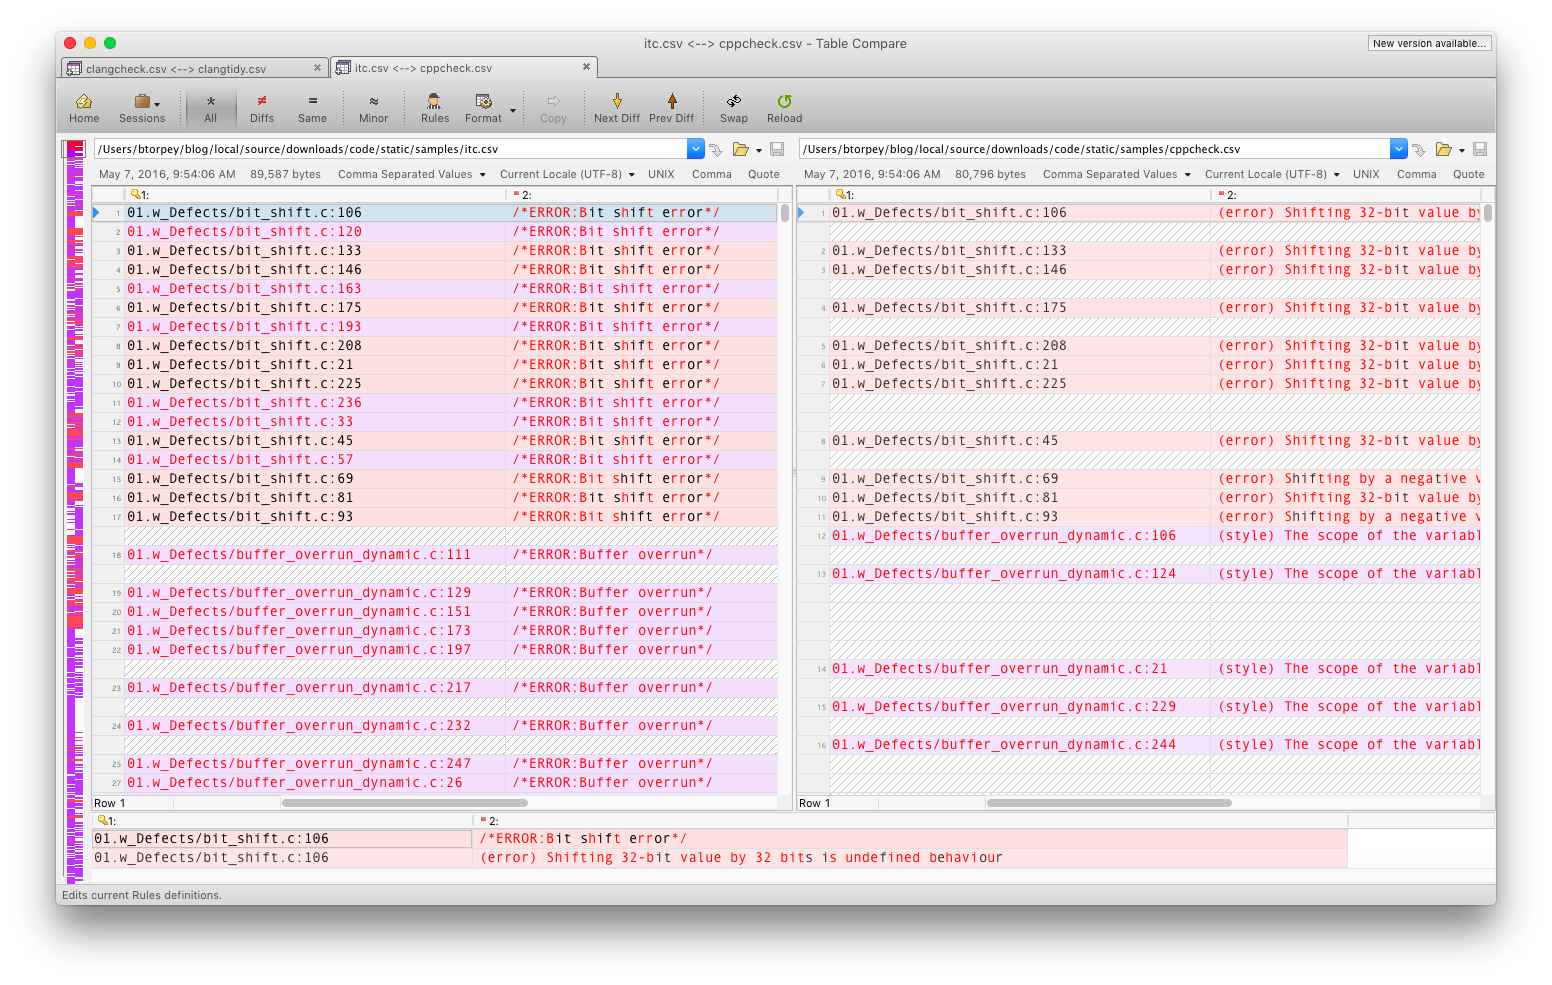
There’s a certain amount of overlap between clang and cppcheck, but there are also significant differences. In my experience, if clang reports something as a problem, it almost certainly is one, but clang also misses a lot of problems that it could detect.
cppcheck can generate more warnings, and some of them are more stylistic issues, but it does detect certain classes of problems, like dead code and arithmetic over/underflow, that clang doesn’t.
As I mentioned earlier, I haven’t found false positives to be a major problem with either clang or cppcheck.
So, each tool has its place, and I like to use both.
Conclusions
Static analysis tools can add real value to the software development process by detecting errors, especially errors in code that is never or almost never executed.
Commercial tools can be expensive (although still cheap compared to the money they save), and open-source tools can sometimes be hard to use (or at least hard to learn how to use).
The provided helper scripts (repo here) should make it much easier to use these tools, and to keep track of warnings and compare the outputs of different tools by using a common format.
They can also be useful for before-and-after comparisions of different versions of a single codebase – for example, as changes are being made to address issues detected by the tools.
Acknowledgements
In addition to the people, projects and organizations mentioned earlier, the people at the NIST have been very helpful, and maintain an incredible collection of resources on the topic of static analysis for a number of languages, not just C++. Some of those resources include the following, and are well worth checking out:
https://samate.nist.gov/index.php/SAMATE_Publications.html
https://samate.nist.gov/SARD/
If you’ve read any of my other posts, you may have noticed that the contents sidebar at the beginning of the article is a new thing. Especially for longer-format articles, that TOC would seem to be very helpful. Many thanks to Robert Riemann for taking the trouble to explain how to do it.
I’ve been using the very nice MacDown editor to create these posts – thanks, Tzu-Ping!
References
Some helpful references that I ran across while researching this article:
Static Code Analysis, John Carmack
CppCon 2015: Jason Turner “The Current State of (free) Static Analysis”
CppCon 2015: Neil MacIntosh “Static Analysis and C++: More Than Lint”
-
Robert Pirsig, “Zen and the Art of Motorcycle Maintenance”↩
-
A “false positive” is when a tool reports an error that is actually not.↩
-
Full disclaimer: I have not taken the time to review all of the ITC source to verify that the annotations are accurate and/or complete. For the purpose of this exercise, we’ll agree to assume that they are – but if you’d like to suggest any improvements, I’m guessing the best place to do that would on the repo.↩
-
See https://en.wiktionary.org/wiki/yak_shaving for a description of this colorful term.↩
-
Building and installing Bear from source is relatively straightforward – just keep in mind that you need python >= 2.7.↩
-
As usual, I prefer installing external packages in a non-standard location, so the build script is set up to do that. See this post for an explanation and rationale of this approach).↩
-
Note that cppcheck does not particularly like it when you include system include directories using
-I. Accordingly, we don’t pass the-sswitch to cc_driver.pl when running cppcheck.↩