I’m a visual thinker (I think I may have mentioned that before ), so when I’m analyzing performance, latency, etc. I find it really helpful to be able to visualize what is going on on the machine.
As a result, I had gotten reasonably good at using Excel to produce charts, which sometimes helped to correlate observed behaviors like latency spikes with other events on the machine.
For a bunch of reasons I wanted to move away from Excel, though, and find another tool that would give me the same or better functionality.
For one thing, a little over a year ago I switched to a Mac as my main machine after years of using Windows. There was a certain amount of adjustment, but for the most part it’s been smooth sailing. More than that, I was actually able to recapture some of the fun and excitement I remember from my first Apple (an Apple ][).
I also wanted something that would run on both the Mac and Linux, where I do most of my testing. Last but not least, I wanted something that would be scriptable so I could easily produce consistent charts for multiple test runs.
I looked briefly at R, but ditched it when it used up all the 8GB in my laptop, plus the entire hard disk as swap, for a single dataset of 100,000 points. Probably my bad, but I didn’t have the patience to figure out what I might be doing wrong.
At that point I turned to venerable (some would say crusty) gnuplot. It’s a bit long in the tooth, but I just wanted to plot latency over time, so how hard could that be? Well, I guess it’s pretty easy if you already know how, but starting from scratch is another story.
Which brings me to my rant of the day, directed at techies in general, and to the (us?) Linux/Unix techies in particular.
Short version: I don’t want to learn gnuplot. I don’t even want to have learned gnuplot – even if I could do that by just taking a pill. What I want is to be able to produce decent-looking charts without knowing anything about gnuplot.
To be fair, the gnuplot docs did have some examples – more anyway than you would find in a typical man page, although that’s admittedly a low bar. And while my google-fu is usually pretty good, I just couldn’t find anything on the intertubes that would work for me, so I had to learn just a little gnuplot.
When all else fails, read the instructions.
It turns out that gnuplot works pretty well, and will probably work even better once I learn (sigh) how to use it better.
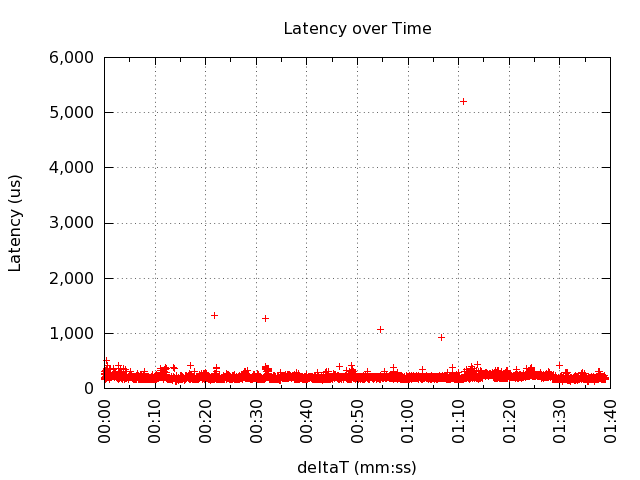
But you don’t have to learn diddly if you don’t want to. Here is the first in what will hopefully be a series of recipes that you can use with little or no modification. Once you’ve downloaded the repo, enter the following at the command prompt:
./tsd.sh ping.csv x11
Which should result in something like this:
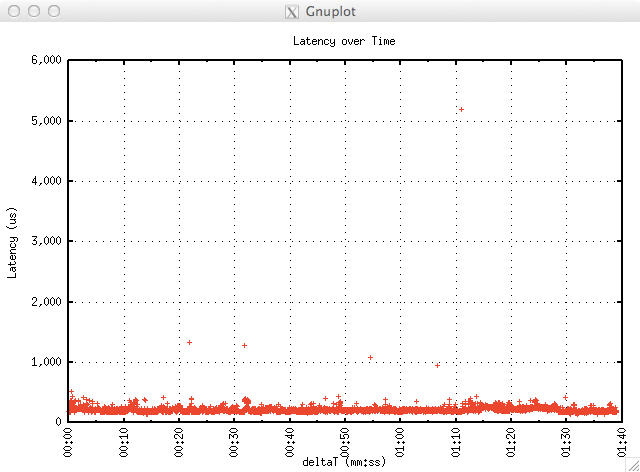
It’s primitive, but that very primitiveness has its own appeal, especially for those of us for whom “UI” means bash, vi or emacs.
A couple of points about the gnuplot command files:
-
Sometimes you care about the actual time that an event took place, so you can correlate it with some other event; sometimes you don’t. Accordingly, I’ve created two different files: one which displays actual time (ts.gp), the other which calculates and displays deltaT (tsd.gp).
-
I’ve been programming in C (and later C++) for many years, but I don’t think I’ve ever purposely used the comma operator before. Well, expressions in gnuplot follow C language rules for operators, precedence, etc. and that comma operator turns out to be handy – in this case it lets us update the origin in the same expression that calculates deltaT. (The return value of the comma operator is the right-hand expression).
– (Note that the above requires something like gnuplot 4.6)
- I’ve left the default terminal in the gnuplot command files, but you can
specify a different one on the command line. To get a list of terminals supported
in your version:
gnuplot -e "set terminal".
Comments, suggestions, pull requests, etc. welcome.